
We take great pleasure in announcing that two of One Concern models were recently presented at the 14TH INTERNATIONAL CONFERENCE ON APPLICATION OF STATISTICS AND PROBABILITY IN CIVIL ENGINEERING (ICASP14) conference. This conference focuses on the applications of statistics and probability in civil engineering and is one of the key global conferences inviting papers and presentations in the domain of resilience modeling. We are privileged to have our work on “Japan General Building Flood Vulnerability Development” [1] and “Power Distribution Network Line Type Classification using a Machine Learning Approach” [2] accepted at this esteemed conference and appreciate the opportunity to present the models to the experts in resilience modeling. A brief summary of the presented work is provided in this blog, and details can be referred to in the published papers.
Japan General Building Flood Vulnerability Development
It is well known that Japan has historically faced many significant catastrophic (CAT) events, including floods, earthquakes, and windstorms, among others. Evaluating the impact of CAT events on buildings is important to estimate direct damage and functional downtime and plan for future events. Since there are no publicly available functions to estimate the flood impacts on buildings at scale, in this study, a series of Japan-specific flood vulnerability and fragility functions are developed for general buildings. A component-based approach is employed to develop flood vulnerability and fragility functions. For this approach, component damage curves and component value ratios are essential. They are developed based on published literature by considering different building attributes, for example, the number of stories, construction material (e.g., wood or non-wood construction), occupancy (e.g., Single Family Dwellings, Multi Family Dwellings, Commercial or Industrial buildings), etc. Then, flood fragility functions were developed using Monte Carlo Simulation with consideration of different sources of uncertainty.
Figure 1 presents an overview of the key steps in the component-based approach to developing the building flood vulnerability curves. The key steps include: 1) calculating component vulnerability curves, 2) estimating component value ratios, and 3) quantifying the impact of unknowns like flood duration, contaminants, and flood velocity on building flood vulnerability. Each of the steps described above considers a component of uncertainty that needs to be appropriately considered in the vulnerability simulation. Published literature is used to develop the key model components [3-8] and [1] contains detailed information on each of the analysis steps.

Figure 1. Different steps in calculating building flood vulnerability
With the distributions of component damage ratios (DRs) and component Value Ratios( VRs) determined, Monte-Carlo(MC) simulation is performed to determine the building DR for a given inundation depth. In order to generate robust estimates of the building DR distribution, MC simulation is performed to calculate DR for each inundation depth and the results are shown in Figure 2. All the component level damage ratio samples are aggregated to calculate the building damage ratio. These building DR samples are used to compute the following: 1) mean DR, 2) standard deviation of DR, 3) empirical DR distribution and 4) probability of exceeding different damage states (DSs) (see Figure 3b). The fragility curves are calculated for DSs 1, 2, and 3 based on DR thresholds of 3%, 20%, and 50%, respectively. For each of the DSs, the probability of exceeding the DS is calculated at each inundation depth as the proportion of samples exceeding the corresponding DR threshold.
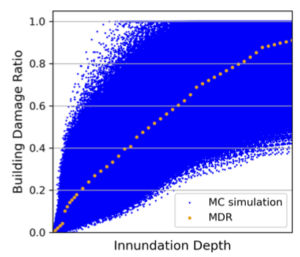
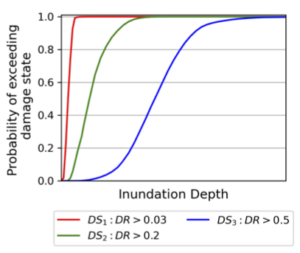
Figure 2.2 story wood SFD buildings, (a) Simulated DRs and mean DR (MDR), and (b) Fragility functions for exceeding different DSs
The approach described here is also scaled to buildings of different occupancies, number of stories, and construction types [1]. Here to verify the prediction trends, we compare the fragility functions by changing different building attributes in Figure 3. Figure 3a shows that wood buildings are typically more fragile than non-wood buildings and is consistent with the intuition that some components in non-wood buildings, like “Frame”, “Exterior wall,” and “Floor,” are less vulnerable than those components in wood buildings. Figure 3b shows the impact of the number of stories on fragility functions for non-wood COM buildings. It can be seen that as the number of stories increases, the building flood fragility reduces. This is per the expectation that at any given constant inundation depth, as the number of stories increases, a smaller percentage of the building value is impacted.
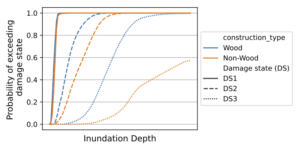
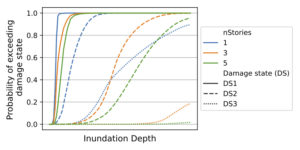
Figure 3. Comparison of fragility functions, (a) Comparison of construction type for 2-story SFD buildings, (b) Comparison of number of stories for non-wood COM buildings.
The developed model is being used for One Concern’s DNA/Domino products for Japan and more details around it can be found in the published manuscript [1].
Power Distribution Network Line Type Classification
All around the world, extreme hazard events such as flooding, tornadoes, and hurricanes have caused widespread power network failure for distribution systems. When Hurricane Irma struck Florida on September 10, 2017, 6.7 million customers experienced power outages, which represents almost one-third of the state population, and some areas had outages longer than a week [9]. Moreover, large-scale damage to the power distribution network can have even more severe impacts on the economy. In 2012, Hurricane Sandy caused power outages for over 8.5 million people, which contributed to over $7 billion in economic losses [10].
Currently, the majority of related research centers on identifying and addressing vulnerabilities due to different types of disaster events for overhead power systems. For instance, Zhou et al. (2006) [11] proposed two methods to predict weather-related power system failure related to overhead power lines using Poisson regression and Bayesian network. The missing first step is to identify the power distribution network type because overhead and underground power lines have very different vulnerabilities under different hazards. Overhead systems are known to be vulnerable to wind hazards (Waseem and Manshadi, 2020), while underground systems are potentially susceptible to flood erosion [12].
The backbone of this study is the ground truth power network type dataset that was generated by the internal data labeling team using map services by manually looking at over 60,000 road segments across most major cities in the U.S. In order to ensure generalization across the entire country, the distribution network types are recorded, which is the machine learning model’s response variable. Other important datasets used for feature selection include the building characteristics dataset, road type dataset, wind and flood hazard maps, rural vs. urban classification shapefile, and the state’s time zone and political stance depending on individual building location.
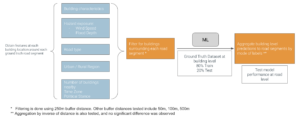
Figure 4. The framework of Power Distribution Network ML model training/testing
The best model achieved an overall accuracy of 75.9%. However, considering the model complexity and data scalability, we choose to use the model with only 5 features for the classification task of the entire US: building’s year-built, total area, property value, number of floors, and occupancy type, and still maintained an accuracy of 72.1%.
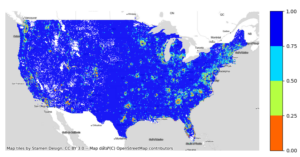
Figure 5. Percentage of overhead power lines within each 5km x 5km grid cell of the U.S.
When inspecting the percentage of overhead power lines in each 5 by 5 km grid cell of the continental US, the hot spots indicate that most power lines are underground; we can see that the model successfully captures locations of the major cities.
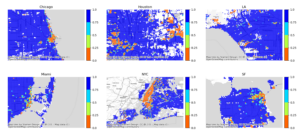
Figure 6. Percentage of overhead power lines within each 250m x 250m grid cell at six major cities
When looking at the more zoomed-in maps of the 6 major cities in the US: Chicago, Houston, LA, Miami, NYC, and SF, we noticed that our model was able to capture most of the downtime areas. Especially for New York, we can see that most of Manhattan Island has underground power lines, which aligns with reality.
Overall, this study presents a novel approach to classifying power line types, which enables power outage simulation on a nationwide scale. We are also constantly collecting ground truth data for further future validations.
References
[1] Chhabra J.P.S, Sakai J., Kim, Y., Patel S. (2023). Development of Flood Vulnerability Functions for General Buildings in Japan using a Component-Based Approach. 14th International Conference on Applications of Statistics and Probability in Civil Engineering, ICASP14. Dublin, Ireland, July 9-13, 2023.
[2] Hong M., Zhai C., Kim Y., Patel S. (2023). Power Distribution Network Type Classification using a Machine Learning Approach. 14th International Conference on Applications of Statistics and Probability in Civil Engineering, ICASP14. Dublin, Ireland, July 9-13, 2023.
[3] Cabinet Office (2013). “Manual of damage evaluation of residential buildings due to natural disasters”.
[4] JFCC (2016). “Manual for approximate cost estimation for architectural engineers”.
[5] MLIT (2005). “Manual for flood impact analysis”.
[6] MLIT (2011). “Committee on evaluation method of river construction/protection project”.
[7] Tada, N., Ikeuchi, K., Hirose, M., Kuribayashi, T., Saruwatari, H., Ito, H., Kubota, K., Oonami, H., Odagiri, A., and Asami, Y. (2013). “Development of evaluation method of house damage due to flood.” Procs. of Advances in River Engineering Vol. 19, 271–2761.
[8] Thieken, A. H., Müller, M., Kreibich, H., and Merz, B. (2005). “Flood damage and influencing factors: New insights from the August 2002 flood in Germany.” Water resources research, 41(12).
[9] Chakalian, P., Kurtz, L., and Hondula, D. (2019). “After the lights go out: Household resilience to electrical grid failure following Hurricane Irma.” Natural Hazards Review, 20.
[10] Nateghi, R., Guikema, S. D., Wu, Y. G., and Bruss, C. B. (2016). “Critical assessment of the foundations of power transmission and distribution reliability metrics and standards.” Risk Analysis, 36(1).
[11] Zhou, Y., Pahwa, A., and Yang, S.-S. (2006). “Modeling weather-related failures of overhead distribution lines.” Power Systems, IEEE Transactions on, 21, 1683 – 1690.8
[12] Miura, Y., Qureshi, H., Ryoo, C., Dinenis, P. C., Li, J., Mandli, K. T., Deodatis, G., Bienstock, D., Lazrus, H., and Morss, R. (2021). “A methodological framework for determining an optimal coastal protection strategy against storm surges and sea level rise.” Natural Hazards, 107(2).
About One Concern
At One Concern, we are a climate resilience technology company dedicated to empowering organizations with actionable insights to address the impacts of business disruption caused by disasters. Through our analytics, we enable risk selection, mitigation, pricing, scenario analysis, and risk management. Our mission is to make disasters less disastrous by helping organizations understand and prepare for downtime from physical climate risks. We are committed to providing the world with the tools needed to effectively mitigate and manage downtime from such risks. Learn more about us at oneconcern.com.